
Prometheus - apache_exporter
您可以找一台您想要監控的站台進行安裝,Prometheus 有許多的套件服務可以到 官方文檔 作參考,這次 BUBU 是安裝監控 apache 服務資訊套件
運行環境
環境都是在 「Proxmox VE 」 虛擬系統上架設,都是以 「 LXC 」模式為主,除非有特殊狀況會告知使用 「 VM 」 模式
- 系統環境: CentOS、Debian、Ubuntu
安裝過程
- 在系統上建立一組帳號及群組
sudo groupadd --system apache_exporter
sudo useradd -s /sbin/nologin --system -g apache_exporter apache_exporter
- 下載
apache_exporter套件
curl -s https://api.github.com/repos/Lusitaniae/apache_exporter/releases/latest|grep browser_download_url|grep linux-amd64|cut -d '"' -f 4|wget -qi -
- 解壓套件
tar -xvf apache_exporter-*.linux-amd64.tar.gz
- 將解壓出來的
apache_exporter執行檔移到/usr/local/bin/目錄下
sudo mv apache_exporter-*.linux-amd64/apache_exporter /usr/local/bin
- 設定可執行權限
sudo chmod +x /usr/local/bin/apache_exporter
- 設定服務
vim /etc/systemd/system/apache_exporter.service
cat >/etc/systemd/system/apache_exporter.service <<___EOF___
[Unit]
Description=Prometheus
Documentation=https://github.com/Lusitaniae/apache_exporter
Wants=network-online.target
After=network-online.target

[Service]
Type=simple
User=apache_exporter
Group=apache_exporter
ExecReload=/bin/kill -HUP $MAINPID
ExecStart=/usr/local/bin/apache_exporter \
  --insecure \
  # 這裡要注意,如果您的狀態頁面有更新 port 號記得要修改
  --scrape_uri=http://localhost/server-status/?auto \
  --telemetry.address=0.0.0.0:9117 \
  --telemetry.endpoint=/metrics

SyslogIdentifier=apache_exporter
Restart=always

[Install]
WantedBy=multi-user.target
___EOF___
- 啟動服務
sudo systemctl daemon-reload && sudo systemctl enable --now apache_exporter
- 確認服務狀態
systemctl status apache_exporter
- 再連到
Prometheus服務設定檔vim /etc/prometheus/prometheus.yml
- job_name: 'apache_exporter'
   static_configs:
     - targets: ['192.168.1.37:9117']
- 確認設定檔是否正確
promtool check config /etc/prometheus/prometheus.yml

- 重啟服務
systemctl restart prometheus
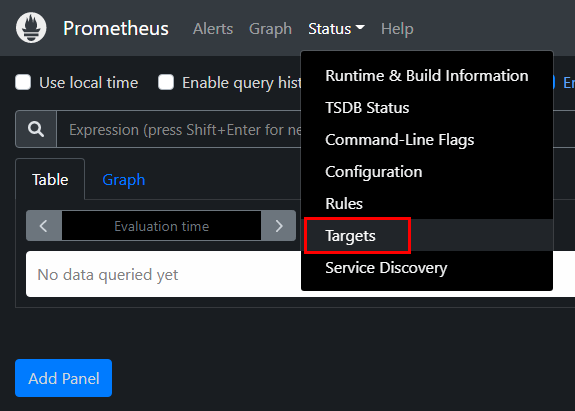
- 再去看後台頁面是否有增加到這一台,要點選
Status-> 選擇Targets
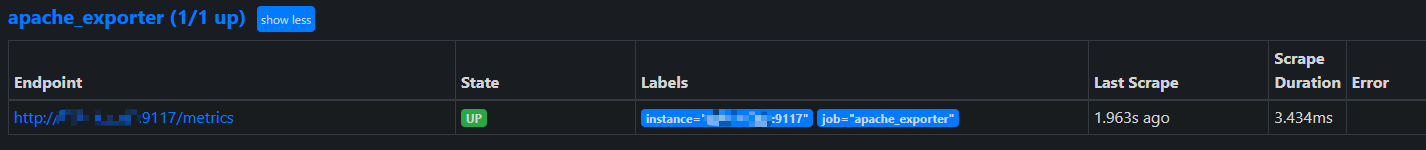
- 進入之後就可以看到您剛剛監控的站台
- 再去 Grafana 站台上的儀表版匯入別人用的面版設定,ID 是
3894