
Prometheus - mysqld_exporter
您可以找一台您想要監控的站台進行安裝,Prometheus 有許多的套件服務可以到 官方文檔 作參考,這次 BUBU 是安裝監控 Mysql\MariaDB 服務資訊套件
2024.10.22 BUBU 現在資料庫已改用 Mariadb 已有些參數在 Mariadb 上面已棄用,內容會在做修改
運行環境
環境都是在 「Proxmox VE 」 虛擬系統上架設,都是以 「 LXC 」模式為主,除非有特殊狀況會告知使用 「 VM 」 模式
- 系統環境: CentOS、Debian、Ubuntu
- 資料庫: MySQL 5.7、Mariadb 11.4
安裝過程
- 在系統上建立一組帳號及群組
sudo groupadd --system mysqld_exporter
sudo useradd -s /sbin/nologin --system -g mysqld_exporter mysqld_exporter
- 下載
Node_Exporter套件
curl -s https://api.github.com/repos/prometheus/mysqld_exporter/releases/latest | grep browser_download_url | grep linux-amd64 | cut -d '"' -f 4 | wget -qi -
- 解壓套件
tar -xvf mysqld_exporter*.tar.gz
- 將解壓出來的
mysqld_exporter執行檔移到/usr/local/bin/目錄下
sudo mv mysqld_exporter-*.linux-amd64/mysqld_exporter /usr/local/bin/
- 設定可執行權限
chmod +x /usr/local/bin/mysqld_exporter
- 查看版本
mysqld_exporter --version
-
在資料庫上建立一組監控帳號及密碼,密碼不能有有符號不然在監控程式會有問題無法使用。
- MySQL 5.7
CREATE USER 'exporter'@'127.0.0.1' IDENTIFIED BY 'XXXXXXXX' WITH MAX_USER_CONNECTIONS 3; GRANT PROCESS, REPLICATION CLIENT, SELECT ON *.* TO 'exporter'@'127.0.0.1'; FLUSH PRIVILEGES; exit;- MaraDB 11.4
CREATE USER 'exporter'@'127.0.0.1' IDENTIFIED BY 'XXXXXXXX' WITH MAX_USER_CONNECTIONS 3; GRANT PROCESS, REPLICATION CLIENT, REPLICATION SLAVE, SLAVE MONITOR, SELECT ON *.* TO 'exporter'@'127.0.0.1'; FLUSH PRIVILEGES; exit; -
在
/etc目錄下建立隱藏給監控用設定檔vim /etc/.my.cnf,輸入您剛剛在資料庫專用監控用的帳號及密碼
[client]
host=127.0.0.1
user=exporter
password=YourPassword
-
設定服務
vim /etc/systemd/system/mysql_exporter.service- MySQL 5.7
cat >/etc/systemd/system/mysql_exporter.service <<___EOF___ [Unit] Description=Prometheus MySQL Exporter After=network.target User=mysqld_exporter Group=mysqld_exporter [Service] Type=simple Restart=always ExecStart=/usr/local/bin/mysqld_exporter \ --config.my-cnf=/etc/.my.cnf \ --collect.auto_increment.columns \ --collect.binlog_size \ --collect.global_status \ --collect.global_variables \ --collect.engine_innodb_status \ --collect.info_schema.processlist \ --collect.info_schema.tablestats \ --collect.info_schema.query_response_time \ --collect.info_schema.userstats \ --collect.info_schema.tables \ --collect.info_schema.innodb_tablespaces \ --collect.info_schema.innodb_cmp \ --collect.info_schema.innodb_cmpmem \ --collect.info_schema.innodb_metrics \ --collect.perf_schema.tablelocks \ --collect.perf_schema.file_events \ --collect.perf_schema.eventswaits \ --collect.perf_schema.indexiowaits \ --collect.perf_schema.tableiowaits \ # 監看 slave 狀態 --collect.slave_status \ --web.listen-address=0.0.0.0:9104 [Install] WantedBy=multi-user.target ___EOF___- MariaDB 11.4
cat >/etc/systemd/system/mysql_exporter.service <<___EOF___ [Unit] Description=Prometheus MySQL Exporter After=network.target User=mysqld_exporter Group=mysqld_exporter [Service] Type=simple Restart=always ExecStart=/usr/local/bin/mysqld_exporter \ --config.my-cnf=/etc/.my.cnf \ --collect.auto_increment.columns \ --collect.binlog_size \ --collect.global_status \ --collect.global_variables \ --collect.engine_innodb_status \ --collect.info_schema.processlist \ --collect.info_schema.tablestats \ --collect.info_schema.query_response_time \ --collect.info_schema.userstats \ --collect.info_schema.tables \ --collect.info_schema.innodb_cmp \ --collect.info_schema.innodb_cmpmem \ --collect.info_schema.innodb_metrics \ --collect.perf_schema.tablelocks \ --collect.perf_schema.file_events \ --collect.perf_schema.eventswaits \ --collect.perf_schema.indexiowaits \ --collect.perf_schema.tableiowaits \ # 監看 slave 狀態 --collect.slave_status \ --web.listen-address=0.0.0.0:9104 [Install] WantedBy=multi-user.target ___EOF___ -
啟動服務
sudo systemctl daemon-reload && sudo systemctl enable --now mysql_exporter
- 確認服務狀態
systemctl status mysql_exporter
- 再連到
Prometheus服務設定檔vim /etc/prometheus/prometheus.yml
- job_name: 'mysql_exporter'
   static_configs:
     - targets: ['192.168.1.37:9104']
- 確認設定檔是否正確
promtool check config /etc/prometheus/prometheus.yml

- 重啟服務
systemctl restart prometheus
- 再去看後台頁面是否有增加到這一台,要點選
Status-> 選擇Targets
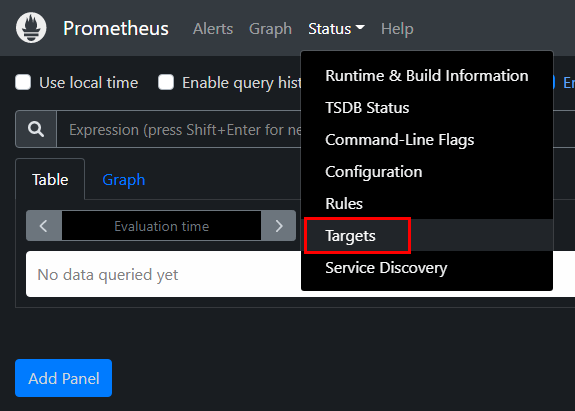
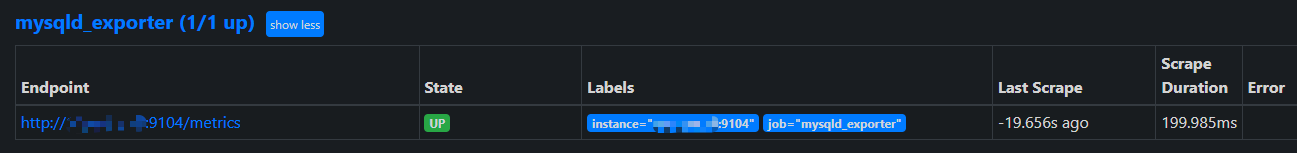
- 進入之後就可以看到您剛剛監控的站台
- 再去 Grafana 站台上的儀表版匯入別人用的面版設定,ID 是
7362
補充說明
因該監控會連同系統資料會相互記錄,那 BUBU 有找到一篇可以做這樣子的修改,請參考看看
- 再連到
Prometheus服務設定檔vim /etc/prometheus/prometheus.yml
# 在 Prometheus 顯示名稱
- job_name: 'web01'
  # 每個 5秒 報告一次
  scrape_interval: 5s
  static_configs:
    # 設定該站台 監控服務相關 port
  - targets: ['192.168.1.90:9100']
    # 預設是 IP 及 port 那因為有時會需要知道系統資訊所以會建議修改名稱自己比好辨示站台服務
    labels:
      instance: web01-90
  - targets: ['192.168.1.90:9104']
    labels:
      instance: web01-90
備註
參考相關網頁
- Mysql Monitoring Guide: Using Mysqld_Exporter, Prometheus And Grafana For Easy Mysql Database Monitoring
- prometheus监控多个MySQL实例
- MySQL Server Exporter github
- Grafana dashboards for efficient database monitoring
- InnoDB Buffer Pool Size % of Total RAM - (Buffer Pool Size of Total RAM) returning No Data
- Prometheus监控MySQL5.7
- Missing grant for MariaDB #640